Last week, the State of Ohio released its “report card” for each school district and the schools within them. Ohio’s report card is the system the state uses to weigh in on the quality of what districts are doing in six categories: Achievement, Progress, Gap Closing, High School Graduation, Early Literacy, and College, Career, Workforce & Military Readiness.
Because the Ohio Revised Code required it—and also because they couldn’t help themselves—a group of people sat around a table and assigned arbitrary weightings to each of these six categories to develop an Overall Rating. The overall rating is meant to boil everything down into something that looks good to hang on a wall or drop into a newspaper headline. But doing so creates a system that reflects the socioeconomics of a community more than the actual quality of its schools. Also, remember that the assessments aren’t the bad guys. It is how the assessments are being used that makes this model a bad way to rate the quality of schools. These assessments were never designed to rate and rank.
What determines how many stars end up in their accountability soup? Good question.
Achievement is measured through assessments given to students beginning in 3rd grade through high school. In grades 3–8, they test reading and math. Science is tested in grades 5 and 8, and in high school, end-of-course exams are given in Algebra I, Geometry, U.S. Government, U.S. History, Biology, and English II. Scores are standardized, and then a group of people assigns descriptive titles to student performance.
Progress is measured through Ohio’s Educational Value-Added Assessment System (EVAAS). This system is based on the idea that a student’s prior test performance serves as the baseline for future test performance, attempting to calculate whether a student made expected, less-than-expected, or more-than-expected progress. It was a good model in theory (I even wrote my dissertation on its implementation years ago and once had dinner with its creator, Bill Sanders). However, Ohio ruined it years ago when it stopped measuring individual progress and instead standardized growth by putting it on the normal curve. That change automatically creates winners and losers.
Here’s why: basic statistics. Once student growth is put on a bell curve, the lowest score (regardless of what a student actually knows) becomes a “1,” and the highest score becomes a “99.” The normal curve doesn’t measure knowledge—it just ranks scores. Statistically, there must always be a “1” and a “99.” So the notion that all students or groups can make progress is a lie.
Bill Sanders’ original EVAAS model wasn’t intended to pit schools and districts against each other. It was designed to identify which students were making progress at the individual and group level, then study what teachers in high-growth classrooms were doing so their practices could be shared. What exists now is, frankly, harmful.
Gap Closing is next—and it’s ugly. I’m a former school psychologist, which means I grew up as a psychometrician and consider myself pretty adept at student assessment. In short: I’m a test dork. And I’ll tell you this—if you’re a measurement person and you study how Ohio’s Gap Closing metric was built, it will make you want to vomit. Honestly, it feels like something cobbled together at midnight on the back of a napkin at an OSBA conference bar. It combines subgroup test scores, graduation rates, gifted student performance, English language proficiency improvement, and chronic absenteeism. It’s Ohio’s equivalent of a Harry Buffalo party: a messy mix that produces more confusion than clarity.
I’ll be blunt: as a superintendent, former assistant superintendent of curriculum, instruction, and assessment, and a former school psychologist who ran RTI teams, I can’t imagine a more useless component. Even with my background in statistics and assessment, I couldn’t coherently explain it to you.
Early Literacy and Workforce Readiness are a hodgepodge. Yes, literacy and readiness matter, but Ohio’s model for literacy progress is broken. It relies on standardized tests, which by design will always place some students at the top and some at the bottom. That structure undermines Ohio’s professed dedication to the “science of reading.” Readiness at least shows some promise because it’s criterion-referenced. Finally, graduation rates simply reflect what this accountability model really measures: community income levels. High-income communities have high graduation rates; low-income communities do not.
Reporter: “So, how do you feel about your district report card? Do you have any comments?” Superintendent: :::thinks and engages in self talk::: “There’s what I want to say and what I have to say.”
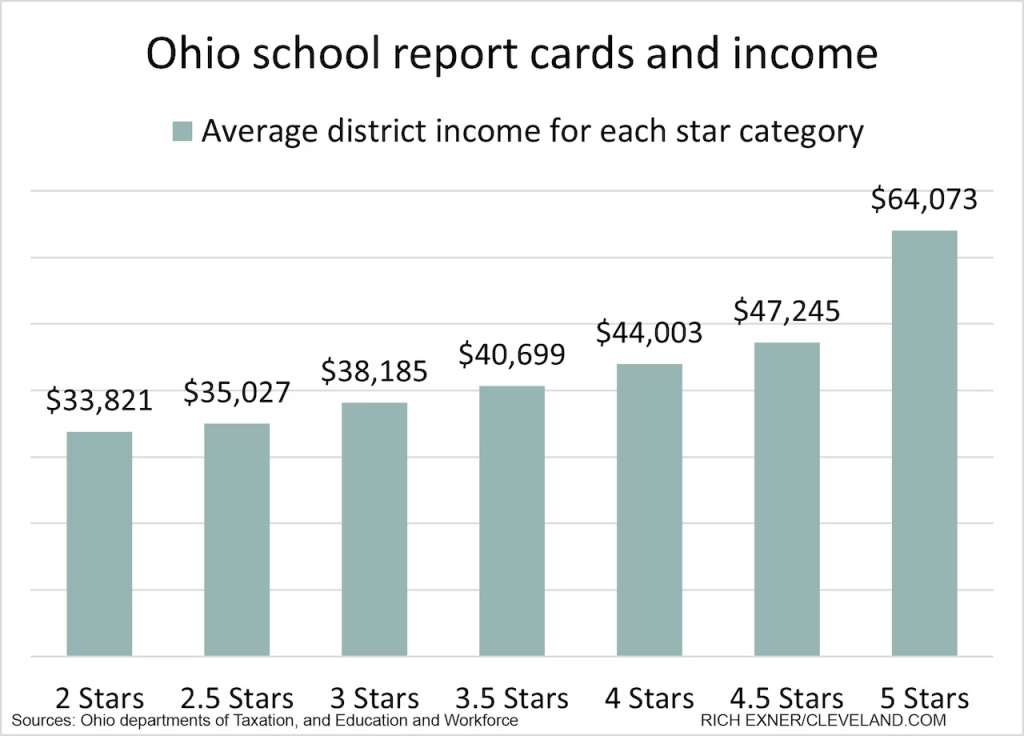
Here’s the truth: the more money your community makes, the higher your district rating will be. That’s it.
Districts like mine have the luxury of ignoring the results and focusing on deep learning, engagement, and preparing students for life. But districts under the thumb of the state—those without wealth—have to double down on test prep, curriculum narrowing, data dives, and constant compliance. The deck is stacked against them. Those of us not as impacted need to speak up for those who cannot.
So how did we do? As a district, our per capita income is $47,511. Guess how we scored?
Rich Exner’s chart from Cleveland.com is below and here is the source of the article https://www.cleveland.com/news/2025/09/see-2025-ohio-school-report-card-grades-for-every-district-in-the-state.html
The Question That Bothers Me the Most
Should success within a state’s accountability model be something obtainable for all districts in a given year?
Answer: It should be. But Ohio’s isn’t.
The current system is built on standardized testing and rests on a bell-shaped curve. For the top 10% to exist, there must also be a bottom 10%. On Ohio’s tests, if 60–70% of students get an item right, that item is thrown out as “too easy.” A “good” test item is one where half the students get it right and half get it wrong. That means success for all is impossible—the tests are designed to sort first, not measure mastery.
If Ohio cared about academic competency, it would use criterion-referenced tests that measure what a student knows, not how they rank against everyone else. Think of it like parachute packing or performing surgery. Either the parachute deploys or it doesn’t. Either the surgery works or it doesn’t. Those are clear, obtainable standards. We could do the same for reading, math, and every other subject. But that’s not what we do.
Fine… Stop Complaining & Offer an Alternative
I’ve spent years chasing better ways to determine school quality. Two scholars I follow closely are John Tanner (Brav-Ed) and Jack Schneider (MCEIA). When building an accountability model, we should ask:
- Should it be correlated with variables that predict long-term student success?
- Should it provide stakeholders with timely, actionable evidence?
- Should it be relevant and understandable to the community?
- Should success be obtainable for all districts in a given year?
- Should it be highly correlated to income levels?
- Should it be truthful and honest?
- Should it help build trust between districts and communities?
(Answer key: 1. yes; 2. yes; 3. yes; 4. yes; 5. no; 6. yes; 7. yes).
Now apply Ohio’s model to those questions. It fails the test. It prevents Olmsted Falls from realizing its locally created vision. Earlier in my career I worshiped at the altar of the bell curve. I’ve since recovered.
Why This Matters
Test-based accountability is institutionalized at the federal and state levels. Both political parties own this. It’s in law, and changing it requires changing law. States can petition to try alternatives, but Ohio hasn’t. So districts that want to innovate must do so while still trapped in this broken model that has never improved student outcomes.
At the very least, decades of poor results should have led to change. But I’m from Cleveland, so I get it.
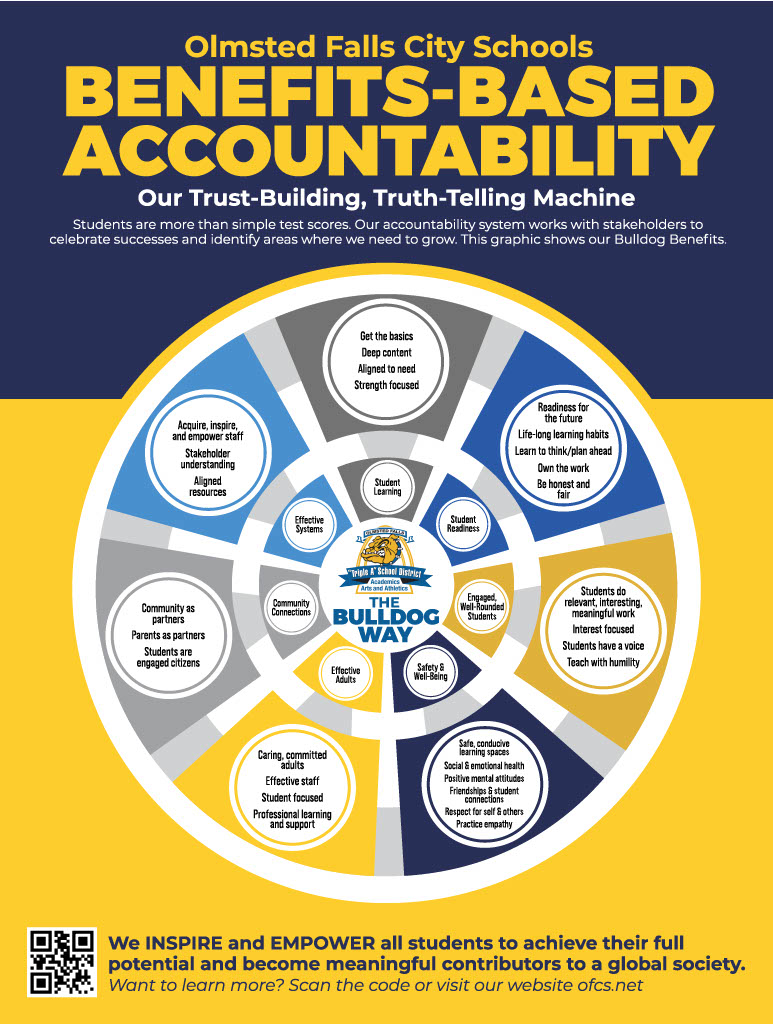
As a local practitioner, I’m frustrated but also motivated. I feel a moral obligation to speak out against a model that doesn’t help students. More importantly, I want to be part of the resistance to create something new—something that reflects our vision to inspire and empower students.
We’ve begun asking our stakeholders what their hopes and dreams are for students, then creating evidence-based ways to report progress back to them. And here’s the thing: when you ask families, employers, and communities what they want for kids, they don’t talk about test scores. They want the basics, yes. But more than that, they want well-rounded, prepared, engaged young people.
Students spend 1,080 hours a year in school. Accountability models reduce all of that to a few 70-minute tests. That may be convenient for realtors and politicians, but it’s a disservice to families and kids. It erodes trust in schools. We can do better—and we must.
